
We have recently extended the native machine learning (ML) based anomaly detection capabilities of Netdata to support all metrics, regardless on their collection frequency (update every).
Previously only metrics collected every second were supported, but now Netdata can run anomaly detection out of the box with zero config on metrics with any collection frequency.
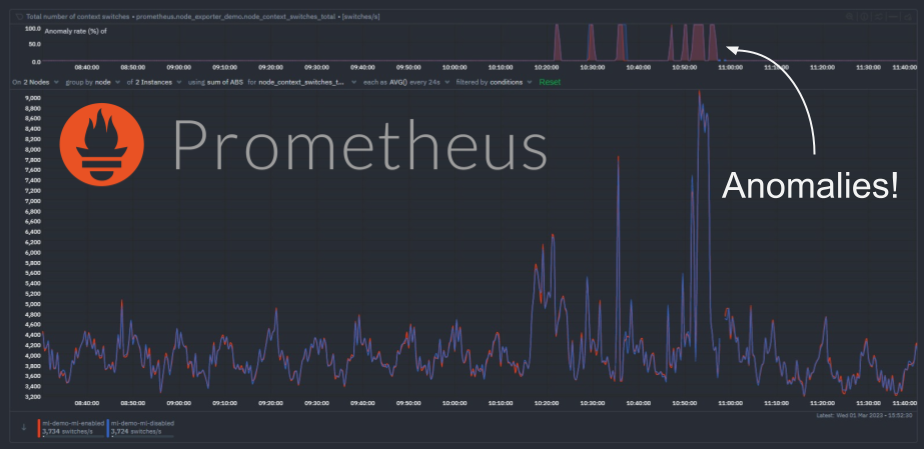
This post will illustrate an example of what this means using Prometheus metrics (via the Netdata Prometheus collector) since they typically have a default collection frequency of 10 seconds.

