
Introducing Netdata's Demo Space, a quick and easy way to experience monitoring environments before you set them up yourself.

Introducing Netdata's Demo Space, a quick and easy way to experience monitoring environments before you set them up yourself.

Hello, fellow data enthusiasts and Google Colab aficionados! Today, we're going to explore how to monitor your Google Colab instances using Netdata. Colab is a fantastic platform for running Notebooks, developing ML models, and other data science and analytics tasks. But have you ever wondered how your Colab instance is performing under the hood? That's where Netdata comes into play!

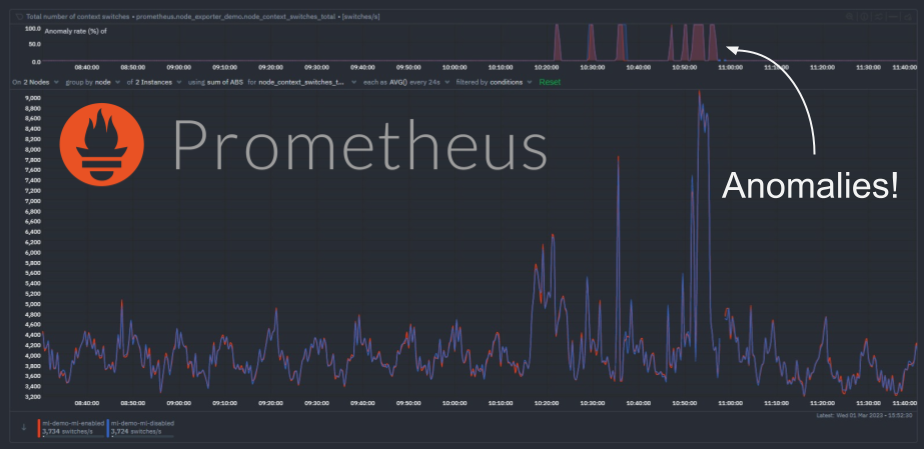
We have recently extended the native machine learning (ML) based anomaly detection capabilities of Netdata to support all metrics, regardless on their collection frequency (update every).
Previously only metrics collected every second were supported, but now Netdata can run anomaly detection out of the box with zero config on metrics with any collection frequency.
This post will illustrate an example of what this means using Prometheus metrics (via the Netdata Prometheus collector) since they typically have a default collection frequency of 10 seconds.
We recently got this great feedback from a dear user in our Discord:
I would really like to use Netdata to monitor custom internal metrics that come from SQL, not a fan of having 10 diff systems doing essentially the same thing as is, Netdata is pretty much all there in that regard, just needs a few extra features.
This is great and exactly what we want, a clear problem or improvement we could make to help make that users monitoring life a little easier.
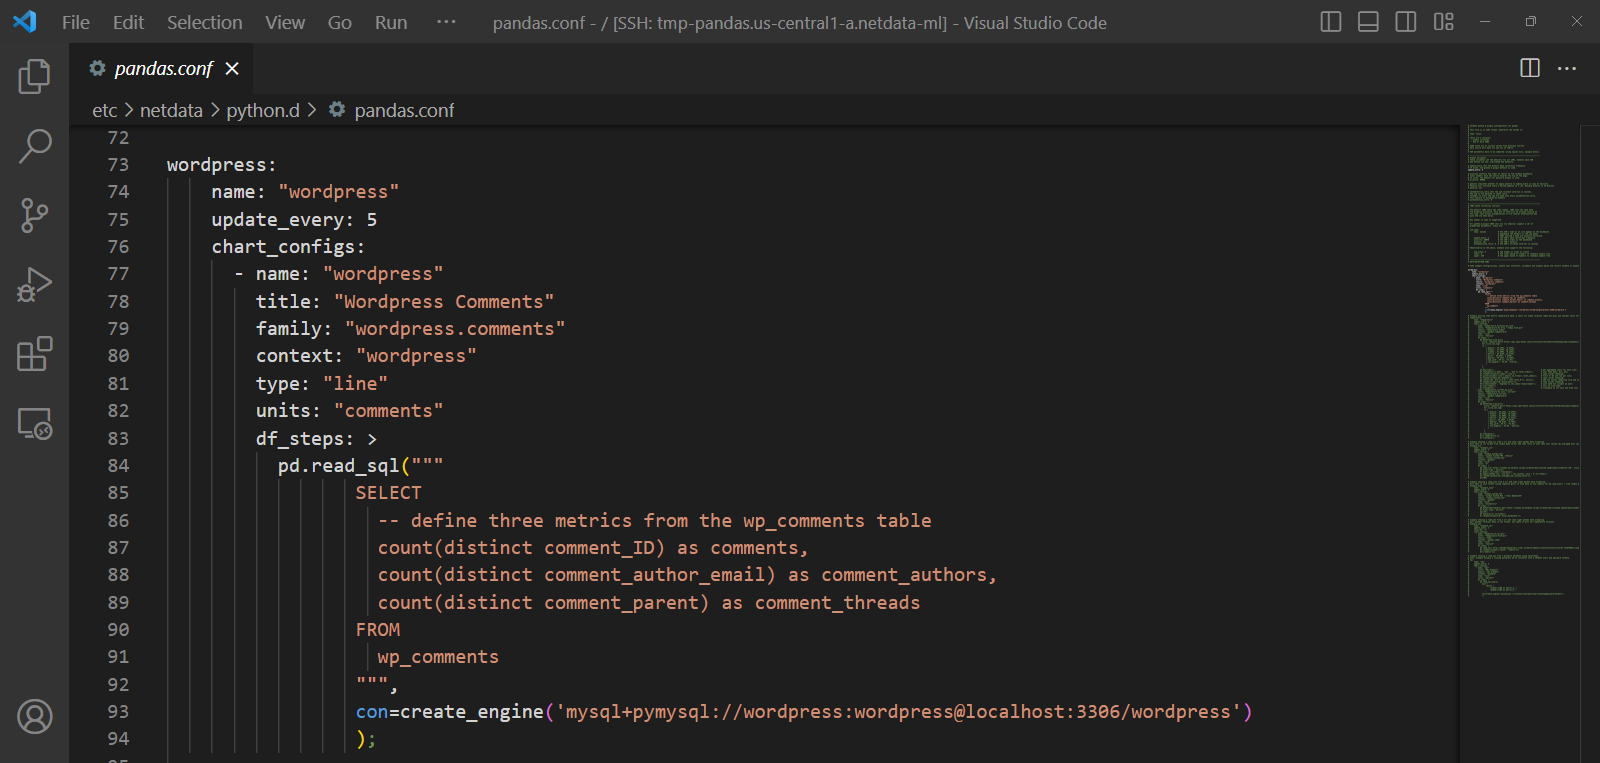
This is also where the beauty of open source comes in and being able to build on the shoulders of giants - adding such a feature turned out to be pretty easy by just extending our existing Pandas collector to support SQL queries leveraging its read_sql() capabilities.
Here is the PR that was merged a few days later.
This blog post will cover an example of using the Pandas collector to monitor some custom SQL metrics from a WordPress MySQL database.

The health management APIs in Netdata allows teams to eliminate unnecessary alerting during scheduled maintenance, testing, auto scaling events, and instance reboots.
Monitoring indoor air quality with Airthings and Netdata. Understanding and measuring common contaminants and pollutants reduces your risk of air quality health concerns.