In this blog post, we will explore the importance of scalability, automation, and AI in the evolving landscape of infrastructure monitoring. We will examine how Netdata's innovative solution aligns with these emerging trends, and how it can empower organizations to effectively manage their modern IT infrastructure.
24 posts tagged with "monitoring"
View All TagsRevolutionizing Operations Centers with Netdata's Real-time Monitoring Solution
In today's fast-paced digital landscape, 24-hour operations centers play a crucial role in managing and monitoring large-scale infrastructures. These centers must be equipped with an effective monitoring solution that addresses their unique needs, enabling them to respond quickly to incidents and maintain optimal system performance. Netdata, a comprehensive monitoring solution, has been designed to meet these critical requirements with its advanced capabilities and recent enhancements.
In this article, we will explore how Netdata's powerful features can transform the way 24-hour operations centers monitor and manage their complex environments, leading to improved incident detection, faster troubleshooting, and better overall system performance.
Monitoring Multi-Cloud and Hybrid-Cloud Infrastructures: Challenges and Best Practices
The advent of multi-cloud and hybrid-cloud architectures has created new opportunities for organizations to leverage best-in-class features from various cloud service providers. However, these complex environments present their own unique challenges, especially when it comes to monitoring and managing performance.
Mastering Cloud Optimization: Strategies for Enhancing Performance and Reducing Costs
Unlock the full potential of your cloud investment! Discover strategies to enhance performance and reduce costs.
Navigating the Path to Cloud Migration: Key Challenges and Best Practices
Embarking on a cloud migration journey? Grasp the obstacles and arm yourself with best practices for a smooth transition. Success lies in understanding, planning, and adapting.
Transforming Monitoring with a Machine Learning-First Approach
Unlocking the full potential of monitoring through ML integration, anomaly detection, and innovative scoring engines.
The Future of Monitoring is Automated and Opinionated
So, you think you monitor your infra?
Monitoring to Infinity and Beyond - How Netdata Scales Without Limits
Scalability is crucial for monitoring systems as it ensures that they can accommodate growth, maintain performance, provide flexibility, optimize costs, enhance fault tolerance, and support informed decision-making, all of which are critical for effective infrastructure management.
Monitoring Disks: Understanding Workload, Performance, Utilization, Saturation, and Latency

Netdata provides a comprehensive set of charts that can help you understand the workload, performance, utilization, saturation, latency, responsiveness, and maintenance activities of your disks. In this blog we will focus on monitoring disks as block devices, not as filesystems or mount points.
Understanding Huge Pages

Memory-intensive applications can benefit from improved performance by using huge pages, as they can reduce TLB pressure and memory fragmentation, and lower the memory management overhead overall. Developers should consider using HugeTLBfs in their mmap() and shmget() calls to take advantage of huge pages.
Transparent Huge Pages (THP) is a Linux kernel feature that provides some of the benefits of huge pages without requiring any development effort. However, THP can cause latency in many applications. Although kernel developers are actively working to address these issues, many system administrators prefer to disable THP altogether.
Netdata can assist in determining whether THP is helpful or harmful to your applications, which can guide your decision regarding its use.
Understanding Entropy: The Key to Secure Cryptography and Randomness

Entropy is a measure of the randomness or unpredictability of data. In the context of cryptography, entropy is used to generate random numbers or keys that are essential for secure communication and encryption. Without a good source of entropy, cryptographic protocols can become vulnerable to attacks that exploit the predictability of the generated keys.
Server Uptime Monitoring: Why do we need it?

Server uptime monitoring tracks the availability and reliability of servers within your infrastructure.
Understanding Context Switching and Its Impact on System Performance

Context switching is the process of switching the CPU from one process, task or thread to another. In a multitasking operating system, such as Linux, the CPU has to switch between multiple processes or threads in order to keep the system running smoothly. This is necessary because each CPU core without hyperthreading can only execute one process or thread at a time. If there are many processes or threads running simultaneously, and very few CPU cores available to handle them, the system is forced to make more context switches to balance the CPU resources among them.
Context switching is an essential function of any multitasking operating system, but it also comes at a cost. The whole process is computationally intensive, and the more context switches that occur, the slower the system becomes. This is because each context switch involves saving the current state of the CPU, loading the state of the new process or thread, and then resuming execution of the new process or thread. This takes time and consumes CPU resources, which can slow down the system.
The impact of context switching on system performance can be significant, especially in systems with many processes or threads running simultaneously.
Understanding Interrupts, Softirqs, and Softnet in Linux

Interrupts, softirqs, and softnet are all critical parts of the Linux kernel that can impact system performance. In this blog post, we'll explore their usefulness, and discuss how to monitor them using Netdata for both bare-metal servers and VMs.
Why Scalable Monitoring is Essential for Modern, Distributed Systems

It's becoming increasingly common to discuss the importance of scalability in monitoring solutions and how it can impact the performance and reliability of distributed systems.
Monitoring remote UNIX-like systems using Netdata and Net-SNMP

Need to monitor a UNIX-like system, but can’t install Netdata on it? With our SNMP collector and Net-SNMP, you can get basic system information with just a bit of relatively quick and easy configuration.
Anomaly detection on Prometheus metrics
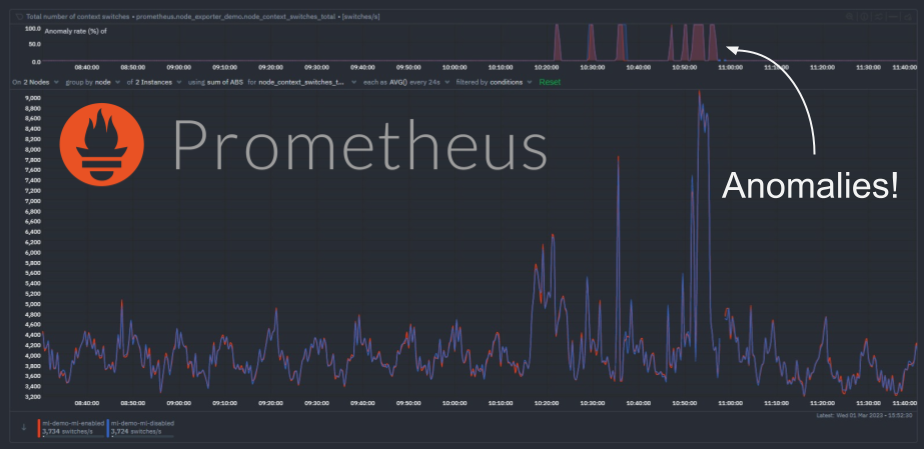
We have recently extended the native machine learning (ML) based anomaly detection capabilities of Netdata to support all metrics, regardless on their collection frequency (update every).
Previously only metrics collected every second were supported, but now Netdata can run anomaly detection out of the box with zero config on metrics with any collection frequency.
This post will illustrate an example of what this means using Prometheus metrics (via the Netdata Prometheus collector) since they typically have a default collection frequency of 10 seconds.
Monitor any SQL metrics with Netdata (and Pandas ❤️)
We recently got this great feedback from a dear user in our Discord:
I would really like to use Netdata to monitor custom internal metrics that come from SQL, not a fan of having 10 diff systems doing essentially the same thing as is, Netdata is pretty much all there in that regard, just needs a few extra features.
This is great and exactly what we want, a clear problem or improvement we could make to help make that users monitoring life a little easier.
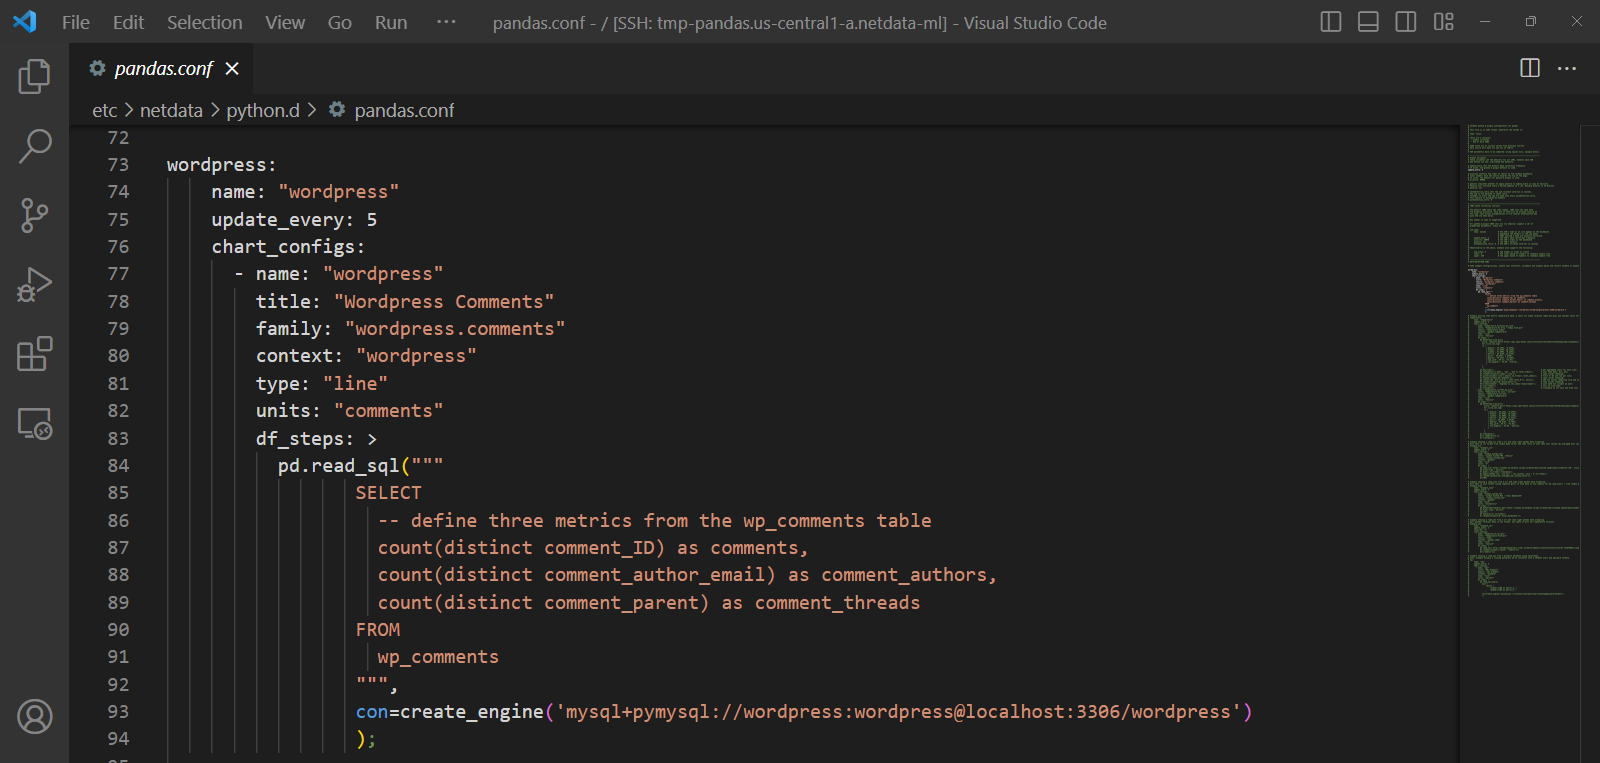
This is also where the beauty of open source comes in and being able to build on the shoulders of giants - adding such a feature turned out to be pretty easy by just extending our existing Pandas collector to support SQL queries leveraging its read_sql() capabilities.
Here is the PR that was merged a few days later.
This blog post will cover an example of using the Pandas collector to monitor some custom SQL metrics from a WordPress MySQL database.
Monitoring & troubleshooting Cassandra with Netdata
How to monitor and troubleshoot Cassandra with Netdata.

How to monitor and fix Database bloats in PostgreSQL?
Database bloat is disk space that was used by a table or index and is available for reuse by the database but has not been reclaimed. Bloat is created when deleting or updating tables and indexes. Here's how to deal with it!
Cassandra monitoring
What are the important Cassandra metrics to monitor and how to monitor them.
How to find out which application is causing server load
We often hear the term load used to describe the state of a server or a device, but we're here to tell you what it means, precisely, and how to monitor it.
How to monitor systemd service liveness
The life of a sysadmin or SRE is often difficult, but occasionally very simple things can make a huge difference. Basic monitoring of your systemd services is one of those simple things, which we sometimes overlook. The simplest question one would want to know is if the thing that’s supposed to be running is actually running at all. If you use systemd services, you can guarantee an answer to that question within minutes using Netdata.
How to monitor host reachability
Most sysadmins and developers have at some point used a few of the popular Linux networking commands or their Windows equivalents to answer the common questions of host reachability - that is, whether a host or service is reachable and how fast it responds.
